GPU-Aware Kubernetes for Inference Workloads
Scheduling, quotas, and capacity planning when teams run local inference models on Kubernetes.
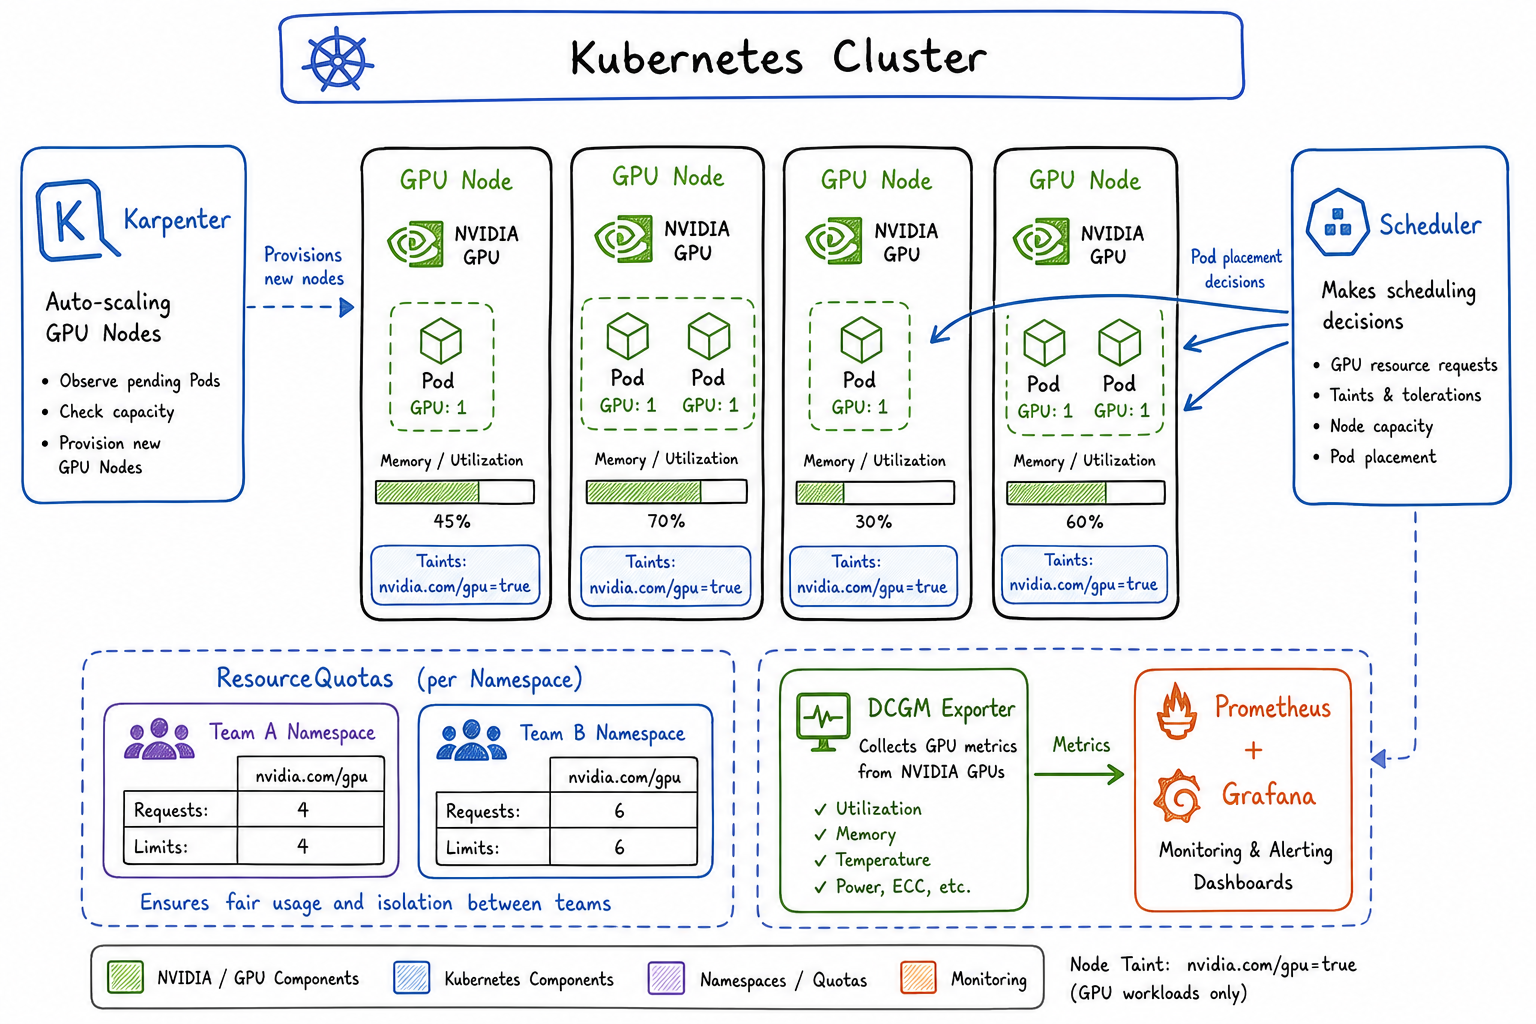
Running inference workloads on Kubernetes has become a core part of our platform story. As more teams adopt local LLMs and computer vision models, I’ve spent the past year building out GPU-aware infrastructure that balances performance, cost, and fair access across teams. Here’s what I’ve learned.
The Challenge of GPU Scheduling in Shared Clusters
GPUs are fundamentally different from CPU and memory. They’re expensive, scarce, and can’t be easily time-sliced the way CPUs can. When I first enabled GPU workloads on our shared cluster, I ran into problems immediately:
- A single team would consume all available GPUs for batch inference jobs
- Nodes would sit idle because pods requested GPUs but barely used them
- Teams had no visibility into when GPUs would become available
- Cost allocation was a nightmare since GPU nodes are 10x the price of standard compute
The standard Kubernetes scheduler treats GPUs as just another resource, but operationally they require dedicated attention.
NVIDIA Device Plugin and GPU Resource Requests
The foundation of GPU scheduling in Kubernetes is the NVIDIA device plugin. It exposes GPUs as nvidia.com/gpu resources that pods can request.
First, deploy the device plugin as a DaemonSet:
apiVersion: apps/v1
kind: DaemonSet
metadata:
  name: nvidia-device-plugin
  namespace: kube-system
spec:
  selector:
    matchLabels:
      name: nvidia-device-plugin
  template:
    metadata:
      labels:
        name: nvidia-device-plugin
    spec:
      tolerations:
        - key: nvidia.com/gpu
          operator: Exists
          effect: NoSchedule
      containers:
        - name: nvidia-device-plugin-ctr
          image: nvcr.io/nvidia/k8s-device-plugin:v0.14.5
          securityContext:
            allowPrivilegeEscalation: false
            capabilities:
              drop: ["ALL"]
          volumeMounts:
            - name: device-plugin
              mountPath: /var/lib/kubelet/device-plugins
      volumes:
        - name: device-plugin
          hostPath:
            path: /var/lib/kubelet/device-plugins
Pods request GPUs like any other resource:
apiVersion: v1
kind: Pod
metadata:
  name: inference-server
spec:
  containers:
    - name: model-server
      image: my-registry/llm-inference:v1.2
      resources:
        limits:
          nvidia.com/gpu: 1
          memory: "32Gi"
        requests:
          nvidia.com/gpu: 1
          memory: "24Gi"
A critical detail: GPU requests and limits must be equal. Unlike CPU, you can’t overcommit GPUs. The device plugin assigns whole GPUs to containers.
Node Selectors, Taints, and Affinity for GPU Nodes
I use a combination of taints, tolerations, and node affinity to control GPU scheduling. This prevents non-GPU workloads from landing on expensive GPU nodes and ensures GPU workloads only run where GPUs exist.
Taint your GPU nodes:
kubectl taint nodes gpu-node-1 nvidia.com/gpu=present:NoSchedule
kubectl label nodes gpu-node-1 accelerator=nvidia-a100
kubectl label nodes gpu-node-1 gpu-memory=80Gi
For inference deployments, I use node affinity to target specific GPU types:
apiVersion: apps/v1
kind: Deployment
metadata:
  name: llm-inference
  namespace: ml-team-a
spec:
  replicas: 2
  selector:
    matchLabels:
      app: llm-inference
  template:
    metadata:
      labels:
        app: llm-inference
    spec:
      tolerations:
        - key: nvidia.com/gpu
          operator: Equal
          value: present
          effect: NoSchedule
      affinity:
        nodeAffinity:
          requiredDuringSchedulingIgnoredDuringExecution:
            nodeSelectorTerms:
              - matchExpressions:
                  - key: accelerator
                    operator: In
                    values:
                      - nvidia-a100
                      - nvidia-a10g
          preferredDuringSchedulingIgnoredDuringExecution:
            - weight: 100
              preference:
                matchExpressions:
                  - key: gpu-memory
                    operator: In
                    values:
                      - "80Gi"
      containers:
        - name: inference
          image: my-registry/llm-server:v2.0
          resources:
            limits:
              nvidia.com/gpu: 2
              memory: "64Gi"
            requests:
              nvidia.com/gpu: 2
              memory: "48Gi"
          env:
            - name: MODEL_PATH
              value: "/models/llama-70b"
For multi-GPU inference jobs that need GPUs on the same node, I add pod anti-affinity to spread replicas and topology constraints:
topologySpreadConstraints:
  - maxSkew: 1
    topologyKey: kubernetes.io/hostname
    whenUnsatisfiable: DoNotSchedule
    labelSelector:
      matchLabels:
        app: llm-inference
Quota Management for GPU Resources by Namespace/Team
Fair sharing of GPUs requires quotas. I create ResourceQuotas per namespace to limit how many GPUs each team can consume:
apiVersion: v1
kind: ResourceQuota
metadata:
  name: gpu-quota
  namespace: ml-team-a
spec:
  hard:
    requests.nvidia.com/gpu: "4"
    limits.nvidia.com/gpu: "4"
    persistentvolumeclaims: "10"
---
apiVersion: v1
kind: ResourceQuota
metadata:
  name: gpu-quota
  namespace: ml-team-b
spec:
  hard:
    requests.nvidia.com/gpu: "2"
    limits.nvidia.com/gpu: "2"
    persistentvolumeclaims: "5"
I also use LimitRanges to set defaults and prevent teams from requesting unreasonable amounts per pod:
apiVersion: v1
kind: LimitRange
metadata:
  name: gpu-limits
  namespace: ml-team-a
spec:
  limits:
    - type: Container
      max:
        nvidia.com/gpu: "2"
      default:
        memory: "16Gi"
      defaultRequest:
        memory: "8Gi"
    - type: Pod
      max:
        nvidia.com/gpu: "4"
For more sophisticated scenarios, I’ve deployed Kubernetes priority classes to allow preemption of lower-priority batch jobs when interactive inference needs resources:
apiVersion: scheduling.k8s.io/v1
kind: PriorityClass
metadata:
  name: inference-critical
value: 1000000
globalDefault: false
description: "Priority for production inference workloads"
preemptionPolicy: PreemptLowerPriority
---
apiVersion: scheduling.k8s.io/v1
kind: PriorityClass
metadata:
  name: batch-inference
value: 100000
globalDefault: false
description: "Priority for batch/offline inference jobs"
preemptionPolicy: PreemptLowerPriority
Autoscaling Considerations
GPU autoscaling is trickier than standard compute. Nodes take longer to provision, and you need to balance responsiveness against cost.
Karpenter Configuration
I prefer Karpenter for GPU workloads because of its speed and flexibility. Here’s my NodePool configuration:
apiVersion: karpenter.sh/v1beta1
kind: NodePool
metadata:
  name: gpu-inference
spec:
  template:
    spec:
      requirements:
        - key: karpenter.k8s.aws/instance-category
          operator: In
          values: ["g", "p"]
        - key: karpenter.k8s.aws/instance-family
          operator: In
          values: ["g5", "p4d"]
        - key: kubernetes.io/arch
          operator: In
          values: ["amd64"]
        - key: karpenter.sh/capacity-type
          operator: In
          values: ["on-demand", "spot"]
      nodeClassRef:
        name: gpu-node-class
      taints:
        - key: nvidia.com/gpu
          value: present
          effect: NoSchedule
  limits:
    nvidia.com/gpu: 20
  disruption:
    consolidationPolicy: WhenEmpty
    consolidateAfter: 5m
---
apiVersion: karpenter.k8s.aws/v1beta1
kind: EC2NodeClass
metadata:
  name: gpu-node-class
spec:
  amiFamily: AL2
  subnetSelectorTerms:
    - tags:
        karpenter.sh/discovery: my-cluster
  securityGroupSelectorTerms:
    - tags:
        karpenter.sh/discovery: my-cluster
  blockDeviceMappings:
    - deviceName: /dev/xvda
      ebs:
        volumeSize: 200Gi
        volumeType: gp3
        deleteOnTermination: true
Key decisions I made:
- Consolidation set to WhenEmpty: GPU workloads are sensitive to disruption, so I only consolidate when nodes are completely empty
- 5 minute consolidation delay: Gives time for new pods to schedule before removing capacity
- Mixed spot/on-demand: Spot instances work well for batch inference but production endpoints need on-demand
- Large root volumes: Model weights and container images for inference are huge
Cluster Autoscaler Alternative
If you’re using cluster autoscaler instead:
apiVersion: v1
kind: ConfigMap
metadata:
  name: cluster-autoscaler-config
  namespace: kube-system
data:
  config: |
    {
      "nodeGroups": [
        {
          "name": "gpu-node-group",
          "minSize": 1,
          "maxSize": 10,
          "scaleDownUtilizationThreshold": 0.3,
          "scaleDownUnneededTime": "10m",
          "scaleDownDelayAfterAdd": "15m"
        }
      ]
    }
I set a lower utilization threshold (0.3) because GPU utilization patterns are spiky, and longer delays because GPU node startup takes 5-10 minutes.
Cost Allocation for GPU Workloads
Tracking GPU costs is essential for chargeback. I use a combination of Kubernetes labels and cost allocation tools.
Every GPU workload requires team and cost-center labels:
apiVersion: v1
kind: Namespace
metadata:
  name: ml-team-a
  labels:
    team: ml-team-a
    cost-center: "12345"
    environment: production
---
apiVersion: apps/v1
kind: Deployment
metadata:
  name: inference-service
  namespace: ml-team-a
  labels:
    app: inference-service
    team: ml-team-a
    cost-center: "12345"
spec:
  template:
    metadata:
      labels:
        app: inference-service
        team: ml-team-a
        cost-center: "12345"
I enforce this with a validating admission webhook that rejects GPU workloads without required labels.
For actual cost calculation, I export metrics to our observability stack and calculate:
GPU cost = (GPU-hours used) × (hourly rate for GPU type)Where GPU-hours comes from:
sum by (namespace, team) (
  increase(
    kube_pod_container_resource_requests{
      resource="nvidia_com_gpu"
    }[1h]
  )
)
Monitoring GPU Utilization and Memory
The DCGM exporter provides detailed GPU metrics. Deploy it alongside the device plugin:
apiVersion: apps/v1
kind: DaemonSet
metadata:
  name: dcgm-exporter
  namespace: monitoring
spec:
  selector:
    matchLabels:
      app: dcgm-exporter
  template:
    metadata:
      labels:
        app: dcgm-exporter
    spec:
      tolerations:
        - key: nvidia.com/gpu
          operator: Exists
          effect: NoSchedule
      containers:
        - name: dcgm-exporter
          image: nvcr.io/nvidia/k8s/dcgm-exporter:3.3.0-3.2.0-ubuntu22.04
          ports:
            - name: metrics
              containerPort: 9400
          securityContext:
            runAsNonRoot: false
            runAsUser: 0
          volumeMounts:
            - name: pod-resources
              mountPath: /var/lib/kubelet/pod-resources
      volumes:
        - name: pod-resources
          hostPath:
            path: /var/lib/kubelet/pod-resources
---
apiVersion: v1
kind: Service
metadata:
  name: dcgm-exporter
  namespace: monitoring
  labels:
    app: dcgm-exporter
spec:
  ports:
    - name: metrics
      port: 9400
  selector:
    app: dcgm-exporter
Create a ServiceMonitor for Prometheus:
apiVersion: monitoring.coreos.com/v1
kind: ServiceMonitor
metadata:
  name: dcgm-exporter
  namespace: monitoring
spec:
  selector:
    matchLabels:
      app: dcgm-exporter
  endpoints:
    - port: metrics
      interval: 15s
Key metrics I alert on:
apiVersion: monitoring.coreos.com/v1
kind: PrometheusRule
metadata:
  name: gpu-alerts
  namespace: monitoring
spec:
  groups:
    - name: gpu.rules
      rules:
        - alert: GPUMemoryNearFull
          expr: |
            DCGM_FI_DEV_FB_USED / DCGM_FI_DEV_FB_FREE > 0.9
          for: 5m
          labels:
            severity: warning
          annotations:
            summary: "GPU memory usage above 90%"

        - alert: GPUUtilizationLow
          expr: |
            avg_over_time(DCGM_FI_DEV_GPU_UTIL[1h]) < 20
          for: 2h
          labels:
            severity: info
          annotations:
            summary: "GPU utilization below 20% for 2 hours"

        - alert: GPUTemperatureHigh
          expr: |
            DCGM_FI_DEV_GPU_TEMP > 85
          for: 5m
          labels:
            severity: critical
          annotations:
            summary: "GPU temperature exceeds 85°C"
I built a Grafana dashboard that shows:
- GPU utilization per node and per pod
- GPU memory usage vs. allocated
- Inference latency correlated with GPU metrics
- Cost per team over time
- Queue depth (pending pods waiting for GPUs)
The low utilization alert has been particularly valuable. It’s caught several cases where teams requested GPUs but their models weren’t actually using them effectively, which led to conversations about right-sizing and batching strategies.
Lessons Learned
After a year of running GPU inference on Kubernetes, my main takeaways:
- Start with quotas from day one. Retrofitting them is painful.
- Monitor utilization obsessively. GPUs are too expensive to waste.
- Separate batch and interactive workloads. They have fundamentally different SLOs.
- Plan for slow scaling. GPU nodes take minutes to provision; your autoscaling needs to anticipate demand.
- Make costs visible. Teams make better decisions when they see what they’re spending.
The infrastructure work is substantial, but the payoff is significant: teams can run inference workloads without managing their own GPU servers, costs are controlled and attributed, and the platform scales with demand.