AI Observability: What to Monitor in Production AI Systems
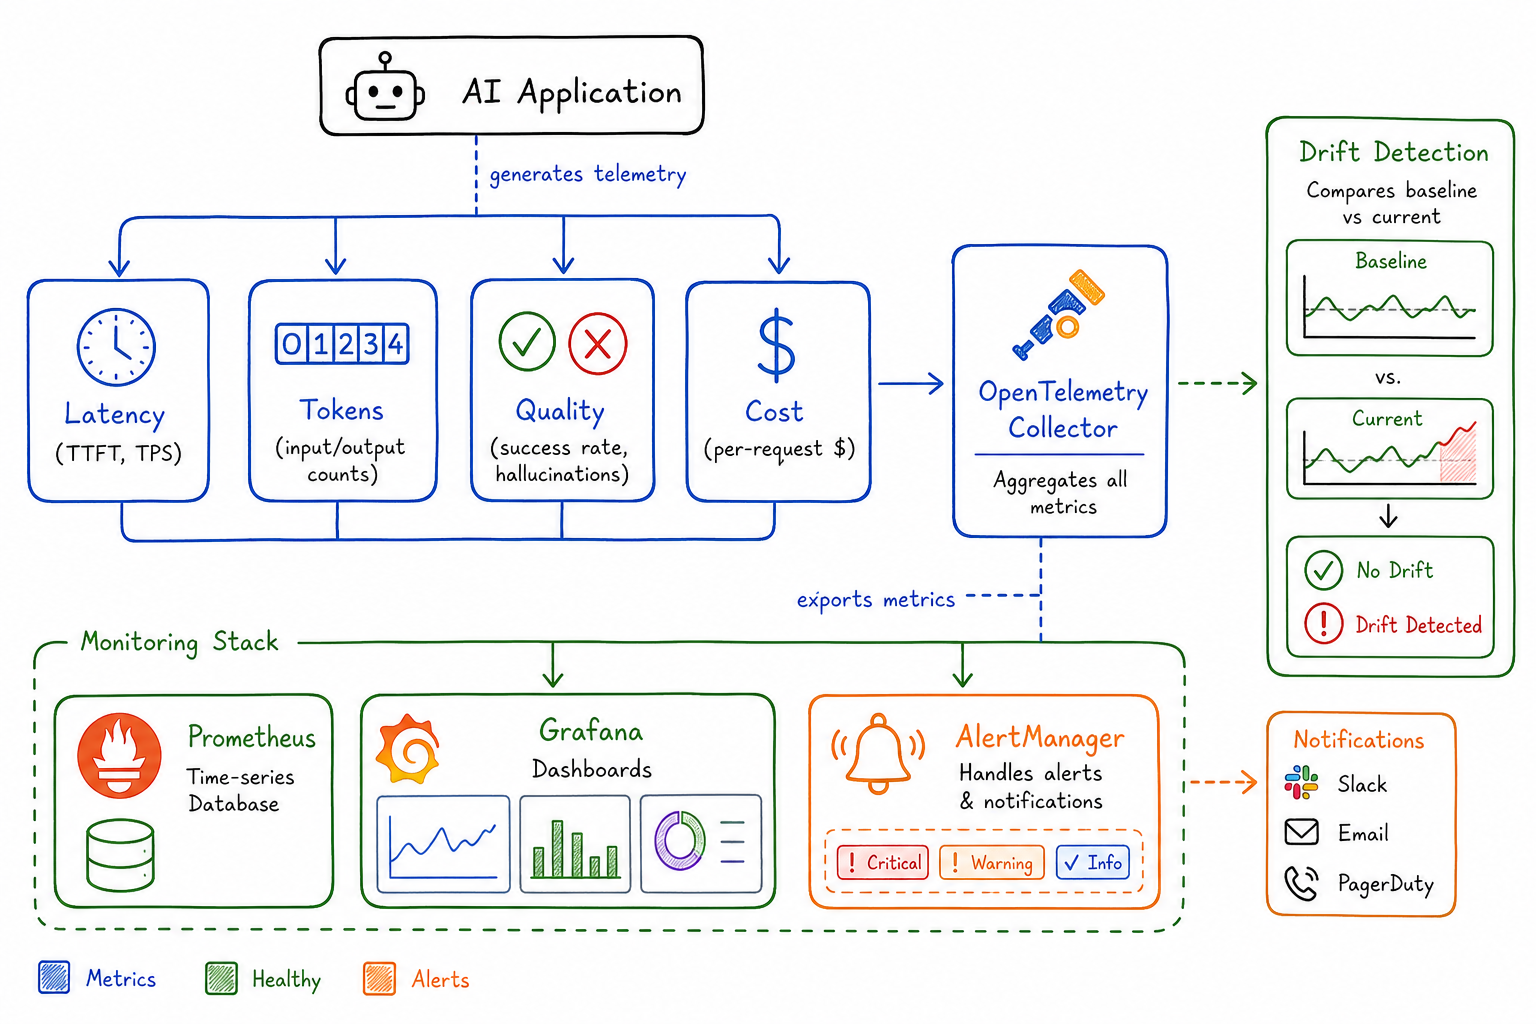
Key metrics for AI systems - latency, token usage, quality signals, cost per task, and drift detection.
After spending months instrumenting our AI-powered services, I’ve learned that traditional APM tools only tell half the story. When a user complains that “the AI gave a wrong answer,” your Datadog dashboard showing 200ms p99 latency and 99.9% availability doesn’t help much. AI systems require a fundamentally different observability approach.
Why Traditional APM Isn’t Enough for AI Workloads
Traditional application monitoring focuses on three pillars: latency, errors, and throughput. These matter for AI systems too, but they miss critical dimensions unique to AI workloads.
Consider this scenario: your LLM-powered chatbot has perfect uptime, sub-second response times, and zero 5xx errors. Yet users are churning because the responses are unhelpful, overly verbose, or occasionally hallucinating facts. Your existing dashboards show green across the board while the product burns.
AI systems introduce new failure modes:
- Quality degradation without errors: The model returns a valid response that’s factually wrong
- Cost explosions: A prompt injection causes the model to generate 10x normal token counts
- Invisible drift: Model behavior changes subtly over time as upstream providers update weights
- Cascading context failures: RAG retrieval returns irrelevant documents, poisoning downstream generation
We need observability that captures these AI-specific concerns alongside traditional metrics.
Key Metrics: Latency, Tokens, and Error Rates
Latency Breakdown
For AI systems, I track latency at multiple granularities:
Time to First Token (TTFT): How long until the user sees the first character of the response. Critical for perceived responsiveness.
ai_ttft_seconds{model="gpt-4", endpoint="/chat"} histogramTokens Per Second (TPS): Generation throughput after the first token. Users notice when responses “type” slowly.
ai_tokens_per_second{model="gpt-4", endpoint="/chat"} histogramEnd-to-End Latency: Total time including any preprocessing (embeddings, retrieval) and postprocessing.
ai_request_duration_seconds{model="gpt-4", stage="total|embedding|retrieval|generation|postprocess"} histogramI’ve found TTFT is the metric users feel most acutely. A 5-second TTFT with fast streaming feels worse than 3-second TTFT with slower streaming, even if total time is similar.
Token Usage
Token counts directly impact cost and can signal problems:
ai_tokens_total{model="gpt-4", type="prompt|completion", endpoint="/chat"} counter
ai_tokens_per_request{model="gpt-4", type="prompt|completion"} histogram
Watch for:
- Prompt token spikes: May indicate prompt injection or runaway context accumulation
- Completion token anomalies: Model rambling or getting stuck in loops
- Ratio changes: Completion/prompt ratio shifting could indicate changed model behavior
Error Rates by Category
AI errors need categorization beyond HTTP status codes:
ai_errors_total{model="gpt-4", error_type="rate_limit|context_length|content_filter|timeout|api_error"} counterRate limit errors specifically need their own tracking—they’re not failures per se, but they impact user experience and indicate capacity planning needs.
Quality Signals: Hallucination Detection and Task Success
This is where AI observability gets interesting. We need to measure output quality, not just output existence.
Hallucination Detection
I implement lightweight hallucination checks for critical paths:
ai_hallucination_detected{model="gpt-4", detection_method="citation_check|entity_verification|self_consistency"} counter
ai_factual_grounding_score{model="gpt-4"} histogram
Detection methods I’ve used:
- Citation verification: For RAG systems, check if claims in the response actually appear in retrieved documents
- Entity extraction and validation: Extract named entities and verify against known-good sources
- Self-consistency: Ask the same question multiple ways and flag divergent answers
None of these are perfect, but they provide signal. Even a 70% accurate hallucination detector helps when you’re processing thousands of requests.
Task Success Rates
Define success metrics specific to your use case:
ai_task_success{model="gpt-4", task_type="summarization|classification|extraction"} counter
ai_task_quality_score{model="gpt-4", task_type="summarization"} histogram
For classification tasks, I sample and manually label a percentage of outputs to track accuracy over time. For generation tasks, I use a combination of:
- User feedback (thumbs up/down)
- Implicit signals (did they copy the response? Did they regenerate?)
- Automated quality checks (response length, format compliance, keyword presence)
Response Quality Dimensions
Beyond binary success, track quality dimensions:
ai_response_relevance_score histogram
ai_response_coherence_score histogram
ai_response_completeness_score histogram
I often use a smaller, faster model to score outputs from the primary model. It’s not perfect, but it scales and catches obvious problems.
Cost Observability: Per-Request Costs and Budget Burn Rate
AI costs can spiral quickly. I’ve seen single runaway requests cost more than a typical day’s traffic.
Per-Request Cost Tracking
Calculate and record cost for every request:
ai_request_cost_dollars{model="gpt-4", endpoint="/chat"} histogram
ai_daily_cost_dollars{model="gpt-4"} gauge
The calculation:
cost = (prompt_tokens * prompt_price_per_1k / 1000) +
       (completion_tokens * completion_price_per_1k / 1000)
Maintain a pricing table that you update when providers change rates (they do, frequently).
Budget Burn Rate
Track spend velocity:
ai_budget_remaining_dollars gauge
ai_burn_rate_dollars_per_hour gauge
ai_projected_monthly_cost_dollars gauge
I set up alerts for:
- Burn rate exceeding 150% of expected
- Projected monthly cost exceeding budget
- Single request cost exceeding threshold (usually 10x median)
Cost Attribution
Break down costs by customer, feature, or team:
ai_cost_dollars{customer_tier="free|pro|enterprise", feature="chat|search|summarize"} counterThis data is invaluable for pricing decisions and identifying which features need optimization.
Model Drift and Performance Degradation Detection
AI systems degrade in ways traditional software doesn’t. The model itself might change (provider updates), or the input distribution might shift.
Output Distribution Monitoring
Track statistical properties of outputs over time:
ai_output_length_tokens histogram
ai_output_sentiment_score histogram
ai_output_confidence_score histogram
Establish baselines and alert on distribution shifts. I use simple statistical tests:
- Mean output length changed by more than 2 standard deviations
- Sentiment distribution significantly different from last week (KL divergence)
- Confidence scores trending downward
Embedding Drift
For RAG systems, monitor embedding space stability:
ai_embedding_centroid_distance gauge
ai_retrieval_relevance_score histogram
If your query embeddings are drifting relative to your document embeddings, retrieval quality will degrade even if nothing else changed.
A/B Baseline Comparison
Keep a shadow model or baseline prompt running on a sample of traffic:
ai_baseline_comparison{metric="quality|latency|cost", variant="current|baseline"} gaugeWhen the primary model’s metrics diverge from the baseline, investigate. This catches provider-side changes you weren’t notified about.
Logging Strategies: Prompts and Completions
Logs are essential for debugging AI issues, but they come with privacy and cost implications.
What to Log
At minimum, I log:
- Request ID (for correlation)
- Model and parameters used
- Token counts (prompt and completion)
- Latency breakdown
- Any error information
For debugging capability, I also log:
- Full prompt (with PII redaction)
- Full completion
- Retrieved context (for RAG)
- Quality scores
Privacy Considerations
User data in prompts requires careful handling:
- PII detection and redaction: Run prompts through a PII detector before logging
- Separate storage: Store raw prompts in a restricted, encrypted store with short retention
- Sampling: Log full prompts for only a percentage of requests
- User consent: Some products require explicit consent for prompt logging
def log_ai_request(prompt, completion, metadata):
    redacted_prompt = pii_redactor.redact(prompt)

    # Always log metadata
    metrics_logger.log(metadata)

    # Conditionally log content
    if should_sample() and user_consented():
        secure_logger.log({
            "prompt": redacted_prompt,
            "completion": completion,
            "request_id": metadata.request_id
        })
Structured Logging Format
I use a consistent schema:
{
  "timestamp": "2025-09-05T10:30:00Z",
  "request_id": "abc-123",
  "model": "gpt-4",
  "endpoint": "/chat",
  "latency_ms": 1250,
  "ttft_ms": 450,
  "prompt_tokens": 1500,
  "completion_tokens": 350,
  "cost_dollars": 0.057,
  "quality_score": 0.85,
  "error": null,
  "metadata": {
    "customer_id": "cust-456",
    "feature": "support_chat"
  }
}
Building AI-Specific Dashboards
My AI observability dashboard has four main sections:
1. Health Overview
Top-line metrics at a glance:
- Request rate (RPM)
- Error rate by type
- P50/P95/P99 latency
- Active cost burn rate
Traffic light indicators for each, with links to detailed views.
2. Quality Panel
- Task success rate over time
- Hallucination detection rate
- User feedback scores (if available)
- Quality score distribution
This panel often reveals problems invisible to traditional monitoring.
3. Cost Analysis
- Hourly/daily cost trend
- Cost by model version
- Cost by feature/endpoint
- Top 10 most expensive requests (for anomaly investigation)
- Projected vs. budgeted spend
4. Model Performance
- Token usage trends
- Output length distribution
- Latency breakdown by stage
- Drift indicators vs. baseline
Dashboard Example Queries
For Prometheus/Grafana:
# Request rate
sum(rate(ai_requests_total[5m])) by (model)

# P99 latency
histogram_quantile(0.99, sum(rate(ai_request_duration_seconds_bucket[5m])) by (le, model))

# Error rate
sum(rate(ai_errors_total[5m])) / sum(rate(ai_requests_total[5m]))

# Hourly cost
sum(increase(ai_request_cost_dollars[1h])) by (model)

# Quality score trend
avg(ai_task_quality_score) by (task_type)
Alerting Strategies for AI Systems
AI alerting requires nuance. Traditional threshold alerts miss quality degradation, while overly sensitive quality alerts create noise.
Tiered Alert Strategy
P1 - Immediate (PagerDuty):
- Error rate > 10% for 5 minutes
- TTFT P99 > 30 seconds
- Zero requests for 2 minutes
- Cost burn rate > 500% of baseline
P2 - Urgent (Slack, business hours):
- Error rate > 5% for 15 minutes
- Quality score drops > 20% from baseline
- Rate limit errors > 100/minute
- Single request cost > $1
P3 - Warning (Slack, async):
- Drift indicators exceeding threshold
- Token usage trending upward
- Quality score variance increasing
- Projected monthly cost exceeding budget
Alert on Derivatives
For AI systems, I find alerting on rate of change more useful than absolute thresholds:
# Alert on quality degradation rate
- alert: AIQualityDegrading
  expr: deriv(ai_task_quality_score[1h]) < -0.1
  for: 30m
  labels:
    severity: warning
  annotations:
    summary: "AI quality score declining rapidly"
Anomaly Detection
Given the variability of AI outputs, statistical anomaly detection often works better than fixed thresholds:
- alert: AILatencyAnomaly
  expr: |
    ai_request_duration_seconds:rate5m
    > (ai_request_duration_seconds:rate5m offset 1d) * 1.5
  for: 15m
Runbook Integration
Every AI alert needs a runbook. Common investigation steps:
- Check if provider reported an incident
- Review recent prompt/model configuration changes
- Sample recent requests for quality issues
- Check input distribution for anomalies
- Verify RAG retrieval quality (if applicable)
Conclusion
AI observability is still an emerging practice. The metrics and approaches I’ve outlined here have evolved from real production incidents—the hallucination that made it to a customer, the cost spike that burned through a month’s budget in a day, the subtle quality degradation that took weeks to notice.
Start with the basics: latency, tokens, errors, and cost. Then layer in quality signals appropriate to your use case. Build dashboards that tell the full story, not just the infrastructure story. Alert on what matters to users, not just what’s easy to measure.
The goal isn’t perfect observability—it’s having enough signal to catch problems before your users do, and enough data to debug them when they occur.